|
FY2012 House 1 |
FY2012 House Final |
FY2012 Senate Final |
FY2012 GAA |
|
|---|---|---|---|---|
| Budget Tracking | 4,687,121 | 4,937,121 | 4,900,000 | 4,937,121 |
|
FY2009 GAA |
FY2010 GAA |
FY2011 GAA |
FY2011 Projected |
FY2012 GAA |
|
|---|---|---|---|---|---|
| Historical Budget Levels | 6,156,294 | 3,809,248 | 5,622,895 | 5,622,895 | 4,937,121 |
* GAA is General Appropriation Act.
| SPENDING CATEGORY |
FY2008 Expended |
FY2009 Expended |
FY2010 Expended |
FY2011 Projected |
FY2012 GAA |
|---|---|---|---|---|---|
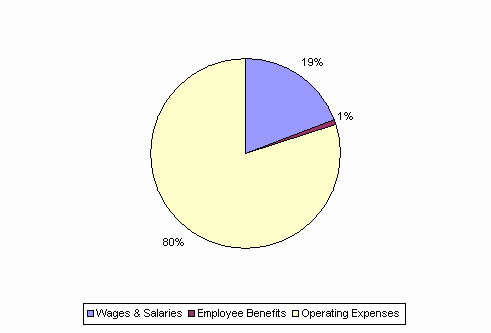
| Wages & Salaries | 1,138 | 1,162 | 1,289 | 1,213 | 947 |
| Employee Benefits | 21 | 18 | 32 | 38 | 35 |
| Operating Expenses | 3,692 | 4,705 | 2,480 | 4,372 | 3,955 |
| TOTAL | 4,851 | 5,885 | 3,801 | 5,623 | 4,937 |
FY2012 Spending Category Chart
