|
FY2012 House 1 |
FY2012 House Final |
FY2012 Senate Final |
FY2012 GAA |
|
|---|---|---|---|---|
| Budget Tracking | 7,401,003 | 7,401,003 | 7,401,003 | 7,401,003 |
|
FY2009 GAA |
FY2010 GAA |
FY2011 GAA |
FY2011 Projected |
FY2012 GAA |
|
|---|---|---|---|---|---|
| Historical Budget Levels | 7,701,237 | 7,048,574 | 6,978,088 | 7,048,574 | 7,401,003 |
* GAA is General Appropriation Act.
| SPENDING CATEGORY |
FY2008 Expended |
FY2009 Expended |
FY2010 Expended |
FY2011 Projected |
FY2012 GAA |
|---|---|---|---|---|---|
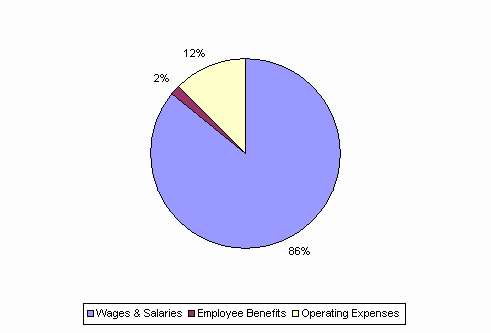
| Wages & Salaries | 5,688 | 6,385 | 6,185 | 6,176 | 6,357 |
| Employee Benefits | 158 | 153 | 92 | 125 | 127 |
| Operating Expenses | 1,407 | 824 | 772 | 748 | 917 |
| Grants & Subsidies | 150 | 146 | 0 | 0 | 0 |
| TOTAL | 7,403 | 7,508 | 7,048 | 7,049 | 7,401 |
FY2012 Spending Category Chart
