|
FY2012 House 1 |
FY2012 House Final |
FY2012 Senate Final |
FY2012 GAA |
|
|---|---|---|---|---|
| Budget Tracking | 4,983,716 | 4,983,716 | 4,983,716 | 4,983,716 |
|
FY2009 GAA |
FY2010 GAA |
FY2011 GAA |
FY2011 Projected |
FY2012 GAA |
|
|---|---|---|---|---|---|
| Historical Budget Levels | 5,185,922 | 4,746,396 | 4,698,932 | 4,746,396 | 4,983,716 |
* GAA is General Appropriation Act.
| SPENDING CATEGORY |
FY2008 Expended |
FY2009 Expended |
FY2010 Expended |
FY2011 Projected |
FY2012 GAA |
|---|---|---|---|---|---|
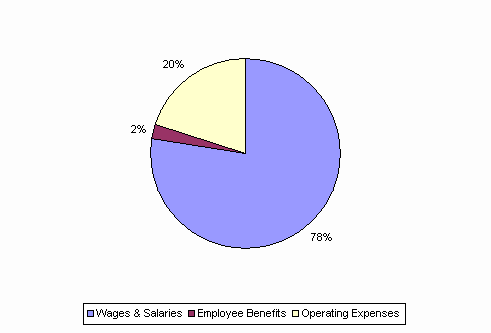
| Wages & Salaries | 3,776 | 3,676 | 3,488 | 3,615 | 3,864 |
| Employee Benefits | 122 | 130 | 110 | 124 | 123 |
| Operating Expenses | 1,108 | 1,171 | 975 | 1,008 | 997 |
| TOTAL | 5,006 | 4,977 | 4,573 | 4,746 | 4,984 |
FY2012 Spending Category Chart
