|
FY2012 House 1 |
FY2012 House Final |
FY2012 Senate Final |
FY2012 GAA |
|
|---|---|---|---|---|
| Budget Tracking | 0 | 116,765,364 | 108,153,535 | 116,765,364 |
|
FY2009 GAA |
FY2010 GAA |
FY2011 GAA |
FY2011 Projected |
FY2012 GAA |
|
|---|---|---|---|---|---|
| Historical Budget Levels | 142,372,102 | 122,138,285 | 119,407,626 | 119,407,626 | 116,765,364 |
* GAA is General Appropriation Act.
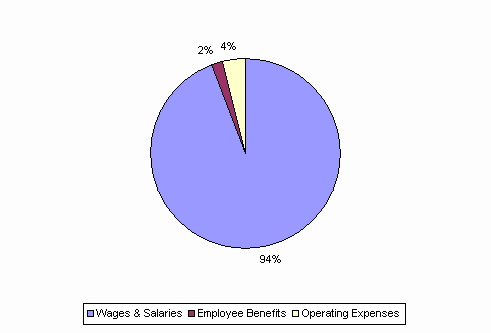
| SPENDING CATEGORY |
FY2008 Expended |
FY2009 Expended |
FY2010 Expended |
FY2011 Projected |
FY2012 GAA |
|---|---|---|---|---|---|
| Wages & Salaries | 122,365 | 125,763 | 118,998 | 112,404 | 109,828 |
| Employee Benefits | 646 | 2,260 | 2,091 | 2,588 | 2,534 |
| Operating Expenses | 7,362 | 6,301 | 4,414 | 4,415 | 4,403 |
| TOTAL | 130,373 | 134,324 | 125,504 | 119,408 | 116,765 |
FY2012 Spending Category Chart