|
FY2012 House 1 |
FY2012 House Final |
FY2012 Senate Final |
FY2012 GAA |
|
|---|---|---|---|---|
| Budget Tracking | 0 | 45,304,806 | 66,261,829 | 45,304,806 |
|
FY2009 GAA |
FY2010 GAA |
FY2011 GAA |
FY2011 Projected |
FY2012 GAA |
|
|---|---|---|---|---|---|
| Historical Budget Levels | 29,294,603 | 28,645,024 | 32,255,081 | 32,255,081 | 45,304,806 |
* GAA is General Appropriation Act.
| SPENDING CATEGORY |
FY2008 Expended |
FY2009 Expended |
FY2010 Expended |
FY2011 Projected |
FY2012 GAA |
|---|---|---|---|---|---|
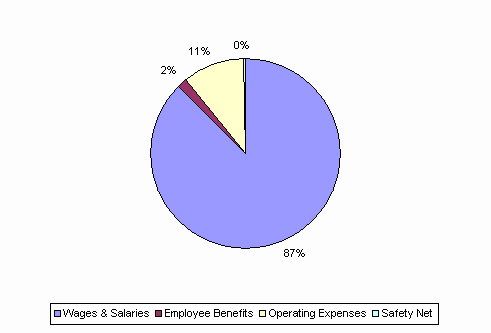
| Wages & Salaries | 14,939 | 23,829 | 23,674 | 27,245 | 39,596 |
| Employee Benefits | 386 | 600 | 609 | 829 | 757 |
| Operating Expenses | 2,961 | 4,249 | 4,248 | 4,065 | 4,803 |
| Safety Net | 113 | 116 | 113 | 117 | 149 |
| TOTAL | 18,399 | 28,794 | 28,645 | 32,255 | 45,305 |
FY2012 Spending Category Chart
