| SPENDING CATEGORY |
FY2007 Expended |
FY2008 Expended |
FY2009 Expended |
FY2010 Projected |
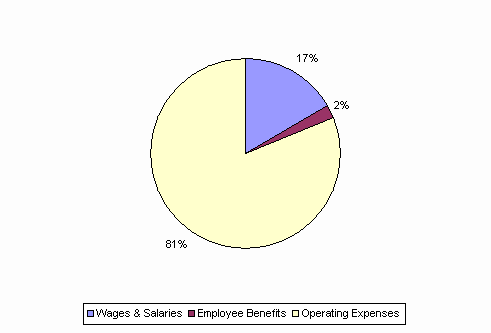
FY2011 GAA |
|---|---|---|---|---|---|
| Wages & Salaries | 2,055 | 2,180 | 1,875 | 1,642 | 1,624 |
| Employee Benefits | 182 | 175 | 204 | 214 | 218 |
| Operating Expenses | 13,019 | 12,233 | 10,976 | 10,314 | 7,881 |
| TOTAL | 15,256 | 14,588 | 13,055 | 12,171 | 9,722 |
FY2011 Spending Category Chart
