|
FY2011 House 2 |
FY2011 House 2 Revised |
FY2011 House Final |
FY2011 Senate Final |
FY2011 GAA |
|
|---|---|---|---|---|---|
| Budget Tracking | 6,277,154 | 6,277,154 | 6,275,328 | 6,367,970 | 6,275,328 |
|
FY2008 GAA |
FY2009 GAA |
FY2010 GAA |
FY2010 Projected |
FY2011 GAA |
|
|---|---|---|---|---|---|
| Historical Budget Levels | 6,325,303 | 6,804,740 | 6,279,770 | 6,277,154 | 6,275,328 |
* GAA is General Appropriation Act.
| SPENDING CATEGORY |
FY2007 Expended |
FY2008 Expended |
FY2009 Expended |
FY2010 Projected |
FY2011 GAA |
|---|---|---|---|---|---|
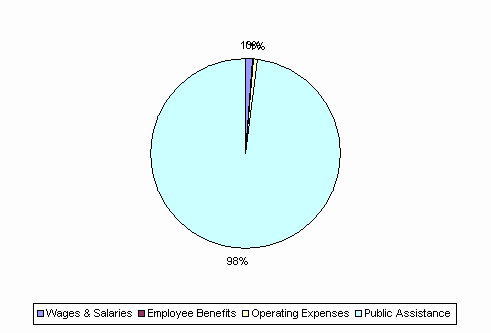
| Wages & Salaries | 66 | 77 | 77 | 79 | 77 |
| Employee Benefits | 1 | 4 | 4 | 2 | 2 |
| Operating Expenses | 23 | 0 | 0 | 47 | 47 |
| Public Assistance | 5,484 | 6,217 | 6,371 | 6,149 | 6,149 |
| TOTAL | 5,574 | 6,298 | 6,453 | 6,277 | 6,275 |
FY2011 Spending Category Chart
