|
FY2011 House 2 |
FY2011 House 2 Revised |
FY2011 House Final |
FY2011 Senate Final |
FY2011 GAA |
|
|---|---|---|---|---|---|
| Budget Tracking | 15,249,147 | 15,249,147 | 15,250,554 | 16,733,776 | 15,250,554 |
|
FY2008 GAA |
FY2009 GAA |
FY2010 GAA |
FY2010 Projected |
FY2011 GAA |
|
|---|---|---|---|---|---|
| Historical Budget Levels | 15,009,445 | 16,246,087 | 16,252,499 | 15,249,147 | 15,250,554 |
* GAA is General Appropriation Act.
| SPENDING CATEGORY |
FY2007 Expended |
FY2008 Expended |
FY2009 Expended |
FY2010 Projected |
FY2011 GAA |
|---|---|---|---|---|---|
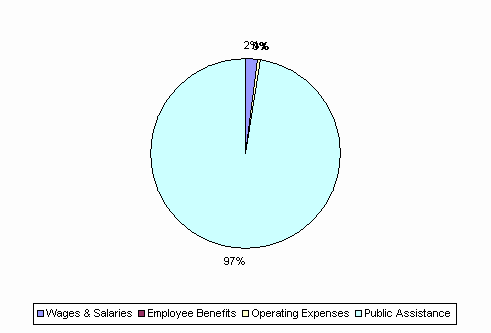
| Wages & Salaries | 80 | 113 | 355 | 285 | 289 |
| Employee Benefits | 3 | 3 | 7 | 8 | 9 |
| Operating Expenses | 0 | 17 | 11 | 100 | 97 |
| Public Assistance | 13,839 | 14,827 | 15,701 | 14,856 | 14,856 |
| TOTAL | 13,923 | 14,961 | 16,075 | 15,249 | 15,251 |
FY2011 Spending Category Chart
