|
FY2011 House 2 |
FY2011 House 2 Revised |
FY2011 House Final |
FY2011 Senate Final |
FY2011 GAA |
|
|---|---|---|---|---|---|
| Budget Tracking | 100,304,918 | 100,304,918 | 100,243,675 | 103,251,164 | 95,310,630 |
|
FY2008 GAA |
FY2009 GAA |
FY2010 GAA |
FY2010 Projected |
FY2011 GAA |
|
|---|---|---|---|---|---|
| Historical Budget Levels | 105,224,938 | 106,715,568 | 100,307,274 | 100,304,918 | 95,310,630 |
* GAA is General Appropriation Act.
| SPENDING CATEGORY |
FY2007 Expended |
FY2008 Expended |
FY2009 Expended |
FY2010 Projected |
FY2011 GAA |
|---|---|---|---|---|---|
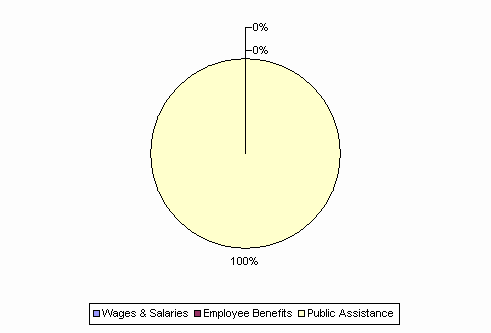
| Wages & Salaries | 54 | 104 | 108 | 69 | 68 |
| Employee Benefits | 3 | 2 | 2 | 2 | 2 |
| Operating Expenses | 41 | 0 | 0 | 60 | 0 |
| Public Assistance | 102,002 | 104,928 | 102,332 | 100,174 | 95,241 |
| TOTAL | 102,101 | 105,034 | 102,442 | 100,305 | 95,311 |
FY2011 Spending Category Chart
