|
FY2011 House 2 |
FY2011 House 2 Revised |
FY2011 House Final |
FY2011 Senate Final |
FY2011 GAA |
|
|---|---|---|---|---|---|
| Budget Tracking | 44,237,906 | 44,237,906 | 44,237,906 | 44,237,906 | 44,016,716 |
|
FY2008 GAA |
FY2009 GAA |
FY2010 GAA |
FY2010 Projected |
FY2011 GAA |
|
|---|---|---|---|---|---|
| Historical Budget Levels | 44,503,974 | 50,324,103 | 45,140,720 | 45,140,720 | 44,016,716 |
* GAA is General Appropriation Act.
| SPENDING CATEGORY |
FY2007 Expended |
FY2008 Expended |
FY2009 Expended |
FY2010 Projected |
FY2011 GAA |
|---|---|---|---|---|---|
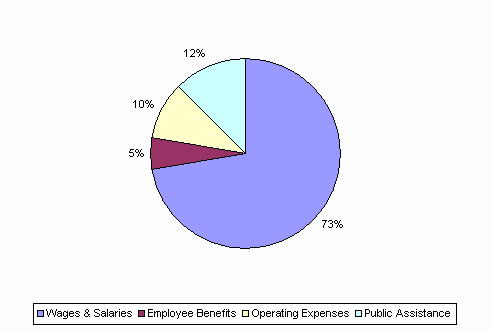
| Wages & Salaries | 33,858 | 37,559 | 37,284 | 33,516 | 31,846 |
| Employee Benefits | 2,358 | 2,511 | 2,268 | 2,309 | 2,371 |
| Operating Expenses | 3,778 | 4,286 | 4,328 | 4,188 | 4,328 |
| Public Assistance | 4,081 | 5,152 | 5,185 | 5,127 | 5,472 |
| TOTAL | 44,075 | 49,509 | 49,065 | 45,141 | 44,017 |
FY2011 Spending Category Chart
