|
FY2011 House 2 |
FY2011 House 2 Revised |
FY2011 House Final |
FY2011 Senate Final |
FY2011 GAA |
|
|---|---|---|---|---|---|
| Budget Tracking | 14,292,924 | 14,292,924 | 14,292,924 | 14,292,924 | 14,221,459 |
|
FY2008 GAA |
FY2009 GAA |
FY2010 GAA |
FY2010 Projected |
FY2011 GAA |
|
|---|---|---|---|---|---|
| Historical Budget Levels | 15,347,658 | 16,259,327 | 14,584,616 | 14,584,616 | 14,221,459 |
* GAA is General Appropriation Act.
| SPENDING CATEGORY |
FY2007 Expended |
FY2008 Expended |
FY2009 Expended |
FY2010 Projected |
FY2011 GAA |
|---|---|---|---|---|---|
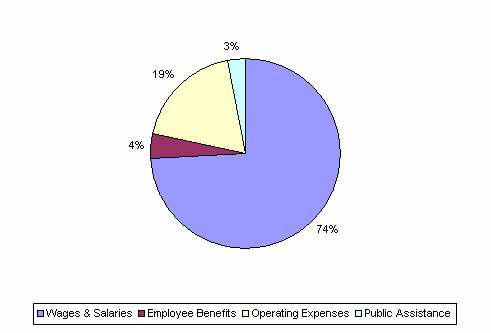
| Wages & Salaries | 11,529 | 12,158 | 12,136 | 11,481 | 10,549 |
| Employee Benefits | 556 | 543 | 597 | 571 | 610 |
| Operating Expenses | 2,708 | 2,777 | 2,598 | 2,135 | 2,639 |
| Public Assistance | 374 | 454 | 457 | 398 | 423 |
| TOTAL | 15,167 | 15,931 | 15,788 | 14,585 | 14,221 |
FY2011 Spending Category Chart
