|
FY2011 House 2 |
FY2011 House 2 Revised |
FY2011 House Final |
FY2011 Senate Final |
FY2011 GAA |
|
|---|---|---|---|---|---|
| Budget Tracking | 59,614,670 | 59,614,670 | 59,614,670 | 59,614,670 | 59,316,597 |
|
FY2008 GAA |
FY2009 GAA |
FY2010 GAA |
FY2010 Projected |
FY2011 GAA |
|
|---|---|---|---|---|---|
| Historical Budget Levels | 64,445,324 | 67,816,384 | 60,831,296 | 60,831,296 | 59,316,597 |
* GAA is General Appropriation Act.
| SPENDING CATEGORY |
FY2007 Expended |
FY2008 Expended |
FY2009 Expended |
FY2010 Projected |
FY2011 GAA |
|---|---|---|---|---|---|
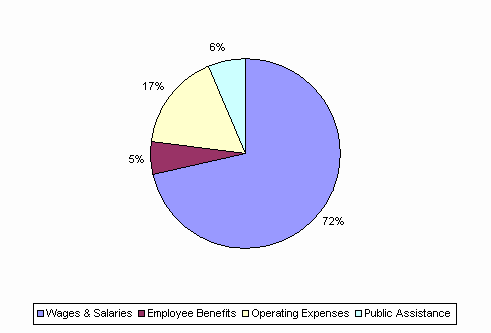
| Wages & Salaries | 41,874 | 46,464 | 48,606 | 44,039 | 42,309 |
| Employee Benefits | 3,118 | 3,439 | 3,538 | 3,215 | 3,259 |
| Operating Expenses | 15,089 | 13,637 | 10,396 | 9,955 | 10,028 |
| Public Assistance | 2,359 | 2,639 | 3,550 | 3,622 | 3,721 |
| TOTAL | 62,440 | 66,179 | 66,090 | 60,831 | 59,317 |
FY2011 Spending Category Chart
