|
FY2011 House 2 |
FY2011 House 2 Revised |
FY2011 House Final |
FY2011 Senate Final |
FY2011 GAA |
|
|---|---|---|---|---|---|
| Budget Tracking | 512,926,029 | 512,926,029 | 505,239,805 | 500,247,571 | 494,964,501 |
|
FY2008 GAA |
FY2009 GAA |
FY2010 GAA |
FY2010 Projected |
FY2011 GAA |
|
|---|---|---|---|---|---|
| Historical Budget Levels | 474,260,601 | 530,536,205 | 521,112,630 | 517,266,194 | 494,964,501 |
* GAA is General Appropriation Act.
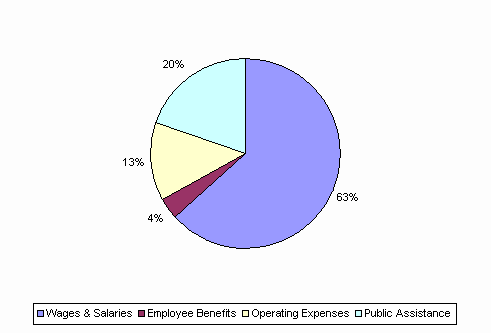
| SPENDING CATEGORY |
FY2007 Expended |
FY2008 Expended |
FY2009 Expended |
FY2010 Projected |
FY2011 GAA |
|---|---|---|---|---|---|
| Wages & Salaries | 291,772 | 348,995 | 338,878 | 333,562 | 313,728 |
| Employee Benefits | 19,165 | 19,009 | 18,380 | 19,091 | 18,308 |
| Operating Expenses | 75,469 | 67,421 | 65,519 | 61,797 | 65,946 |
| Public Assistance | 68,610 | 93,913 | 94,796 | 102,816 | 96,983 |
| Grants & Subsidies | 3,425 | 2,303 | 1,011 | 0 | 0 |
| TOTAL | 458,441 | 531,641 | 518,583 | 517,266 | 494,965 |
FY2011 Spending Category Chart