|
FY2011 House 2 |
FY2011 House 2 Revised |
FY2011 House Final |
FY2011 Senate Final |
FY2011 GAA |
|
|---|---|---|---|---|---|
| Budget Tracking | 7,606,503 | 7,606,503 | 7,606,504 | 7,606,503 | 7,606,503 |
|
FY2008 GAA |
FY2009 GAA |
FY2010 GAA |
FY2010 Projected |
FY2011 GAA |
|
|---|---|---|---|---|---|
| Historical Budget Levels | 8,866,697 | 8,874,872 | 7,613,529 | 7,606,503 | 7,606,503 |
* GAA is General Appropriation Act.
| SPENDING CATEGORY |
FY2007 Expended |
FY2008 Expended |
FY2009 Expended |
FY2010 Projected |
FY2011 GAA |
|---|---|---|---|---|---|
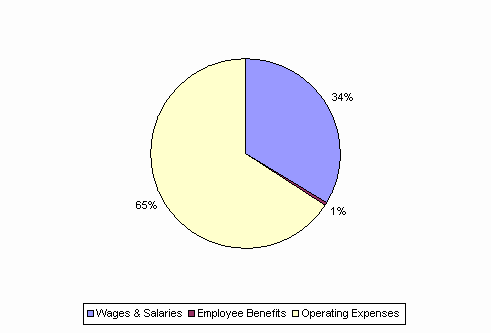
| Wages & Salaries | 2,596 | 2,575 | 2,510 | 2,557 | 2,557 |
| Employee Benefits | 44 | 38 | 41 | 42 | 42 |
| Operating Expenses | 5,538 | 5,316 | 4,750 | 5,008 | 5,008 |
| TOTAL | 8,179 | 7,929 | 7,301 | 7,607 | 7,607 |
FY2011 Spending Category Chart
