|
FY2011 House 2 |
FY2011 House 2 Revised |
FY2011 House Final |
FY2011 Senate Final |
FY2011 GAA |
|
|---|---|---|---|---|---|
| Budget Tracking | 14,411,169 | 14,411,169 | 16,661,169 | 16,861,169 | 14,516,669 |
|
FY2008 GAA |
FY2009 GAA |
FY2010 GAA |
FY2010 Projected |
FY2011 GAA |
|
|---|---|---|---|---|---|
| Historical Budget Levels | 14,557,596 | 19,398,315 | 14,394,926 | 14,365,467 | 14,516,669 |
* GAA is General Appropriation Act.
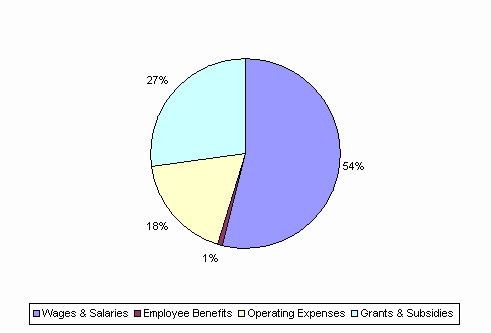
| SPENDING CATEGORY |
FY2007 Expended |
FY2008 Expended |
FY2009 Expended |
FY2010 Projected |
FY2011 GAA |
|---|---|---|---|---|---|
| Wages & Salaries | 7,110 | 7,346 | 7,614 | 7,933 | 7,809 |
| Employee Benefits | 218 | 189 | 135 | 162 | 136 |
| Operating Expenses | 1,645 | 1,692 | 2,163 | 2,667 | 2,625 |
| Grants & Subsidies | 2,074 | 4,546 | 6,069 | 3,604 | 3,946 |
| TOTAL | 11,047 | 13,773 | 15,981 | 14,365 | 14,517 |
FY2011 Spending Category Chart