|
FY2011 House 2 |
FY2011 House 2 Revised |
FY2011 House Final |
FY2011 Senate Final |
FY2011 GAA |
|
|---|---|---|---|---|---|
| Budget Tracking | 234,763,845 | 234,763,845 | 227,233,684 | 234,763,845 | 228,433,683 |
|
FY2008 GAA |
FY2009 GAA |
FY2010 GAA |
FY2010 Projected |
FY2011 GAA |
|
|---|---|---|---|---|---|
| Historical Budget Levels | 249,526,547 | 256,755,080 | 236,186,152 | 232,020,664 | 228,433,683 |
* GAA is General Appropriation Act.
| SPENDING CATEGORY |
FY2007 Expended |
FY2008 Expended |
FY2009 Expended |
FY2010 Projected |
FY2011 GAA |
|---|---|---|---|---|---|
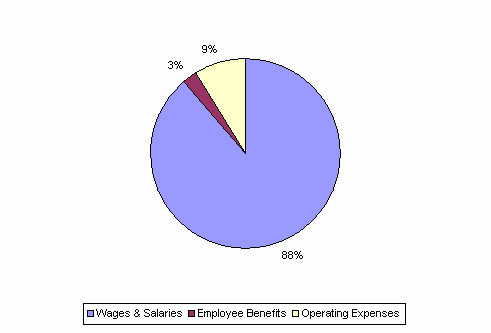
| Wages & Salaries | 224,915 | 215,503 | 213,613 | 211,250 | 202,166 |
| Employee Benefits | 6,089 | 6,091 | 5,516 | 5,900 | 5,823 |
| Operating Expenses | 26,212 | 28,238 | 27,506 | 14,871 | 20,444 |
| Public Assistance | 0 | 0 | 13 | 0 | 0 |
| Grants & Subsidies | 48 | 0 | 0 | 0 | 0 |
| TOTAL | 257,264 | 249,832 | 246,648 | 232,021 | 228,434 |
FY2011 Spending Category Chart
