|
FY2011 House 2 |
FY2011 House 2 Revised |
FY2011 House Final |
FY2011 Senate Final |
FY2011 GAA |
|
|---|---|---|---|---|---|
| Budget Tracking | 13,637,924 | 13,637,924 | 13,164,644 | 13,357,856 | 13,164,644 |
|
FY2008 GAA |
FY2009 GAA |
FY2010 GAA |
FY2010 Projected |
FY2011 GAA |
|
|---|---|---|---|---|---|
| Historical Budget Levels | 15,229,617 | 16,706,813 | 13,809,040 | 13,622,752 | 13,164,644 |
* GAA is General Appropriation Act.
| SPENDING CATEGORY |
FY2007 Expended |
FY2008 Expended |
FY2009 Expended |
FY2010 Projected |
FY2011 GAA |
|---|---|---|---|---|---|
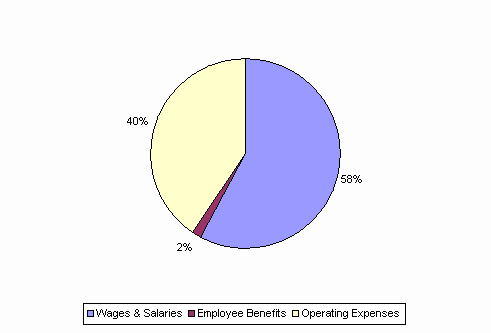
| Wages & Salaries | 6,861 | 7,111 | 8,054 | 8,018 | 7,612 |
| Employee Benefits | 247 | 211 | 250 | 214 | 230 |
| Operating Expenses | 8,303 | 7,445 | 7,367 | 5,391 | 5,323 |
| TOTAL | 15,411 | 14,767 | 15,671 | 13,623 | 13,165 |
FY2011 Spending Category Chart
