|
FY2011 House 2 |
FY2011 House 2 Revised |
FY2011 House Final |
FY2011 Senate Final |
FY2011 GAA |
|
|---|---|---|---|---|---|
| Budget Tracking | 0 | 0 | 11,946,850 | 12,667,991 | 12,086,036 |
|
FY2008 GAA |
FY2009 GAA |
FY2010 GAA |
FY2010 Projected |
FY2011 GAA |
|
|---|---|---|---|---|---|
| Historical Budget Levels | 13,676,739 | 14,077,588 | 11,753,563 | 10,840,503 | 12,086,036 |
* GAA is General Appropriation Act.
| SPENDING CATEGORY |
FY2007 Expended |
FY2008 Expended |
FY2009 Expended |
FY2010 Projected |
FY2011 GAA |
|---|---|---|---|---|---|
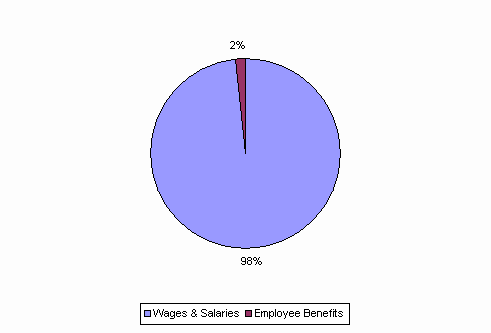
| Wages & Salaries | 12,719 | 13,420 | 13,094 | 10,678 | 11,884 |
| Employee Benefits | 25 | 27 | 200 | 163 | 202 |
| Operating Expenses | 947 | 400 | 0 | 0 | 0 |
| TOTAL | 13,690 | 13,848 | 13,293 | 10,841 | 12,086 |
FY2011 Spending Category Chart
