|
FY2011 House 2 |
FY2011 House 2 Revised |
FY2011 House Final |
FY2011 Senate Final |
FY2011 GAA |
|
|---|---|---|---|---|---|
| Budget Tracking | 0 | 0 | 12,197,320 | 12,933,581 | 12,339,425 |
|
FY2008 GAA |
FY2009 GAA |
FY2010 GAA |
FY2010 Projected |
FY2011 GAA |
|
|---|---|---|---|---|---|
| Historical Budget Levels | 13,937,728 | 14,372,730 | 11,999,981 | 11,067,778 | 12,339,425 |
* GAA is General Appropriation Act.
| SPENDING CATEGORY |
FY2007 Expended |
FY2008 Expended |
FY2009 Expended |
FY2010 Projected |
FY2011 GAA |
|---|---|---|---|---|---|
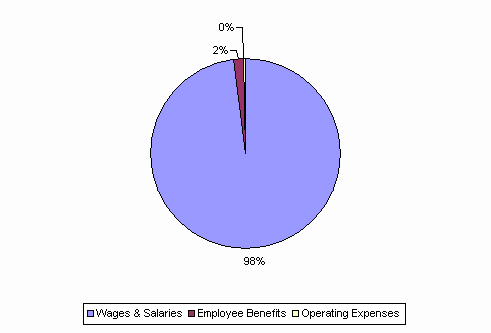
| Wages & Salaries | 13,356 | 13,919 | 13,344 | 10,884 | 12,111 |
| Employee Benefits | 227 | 216 | 208 | 170 | 210 |
| Operating Expenses | 19 | 21 | 18 | 14 | 18 |
| TOTAL | 13,602 | 14,156 | 13,569 | 11,068 | 12,339 |
FY2011 Spending Category Chart
