|
FY2011 House 2 |
FY2011 House 2 Revised |
FY2011 House Final |
FY2011 Senate Final |
FY2011 GAA |
|
|---|---|---|---|---|---|
| Budget Tracking | 0 | 0 | 21,090,576 | 21,842,143 | 21,336,291 |
|
FY2008 GAA |
FY2009 GAA |
FY2010 GAA |
FY2010 Projected |
FY2011 GAA |
|
|---|---|---|---|---|---|
| Historical Budget Levels | 23,819,332 | 24,852,111 | 20,749,354 | 19,137,465 | 21,336,291 |
* GAA is General Appropriation Act.
| SPENDING CATEGORY |
FY2007 Expended |
FY2008 Expended |
FY2009 Expended |
FY2010 Projected |
FY2011 GAA |
|---|---|---|---|---|---|
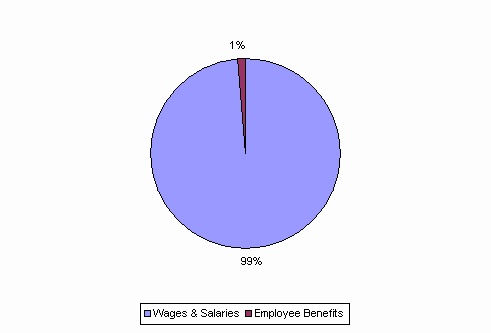
| Wages & Salaries | 22,258 | 24,081 | 23,164 | 18,890 | 21,030 |
| Employee Benefits | 1 | 0 | 303 | 247 | 307 |
| Operating Expenses | 844 | 60 | 0 | 0 | 0 |
| Grants & Subsidies | 100 | 100 | 0 | 0 | 0 |
| TOTAL | 23,203 | 24,241 | 23,468 | 19,137 | 21,336 |
FY2011 Spending Category Chart
