|
FY2011 House 2 |
FY2011 House 2 Revised |
FY2011 House Final |
FY2011 Senate Final |
FY2011 GAA |
|
|---|---|---|---|---|---|
| Budget Tracking | 0 | 0 | 23,600,475 | 24,175,058 | 23,875,432 |
|
FY2008 GAA |
FY2009 GAA |
FY2010 GAA |
FY2010 Projected |
FY2011 GAA |
|
|---|---|---|---|---|---|
| Historical Budget Levels | 26,997,992 | 27,809,654 | 23,218,646 | 21,414,936 | 23,875,432 |
* GAA is General Appropriation Act.
| SPENDING CATEGORY |
FY2007 Expended |
FY2008 Expended |
FY2009 Expended |
FY2010 Projected |
FY2011 GAA |
|---|---|---|---|---|---|
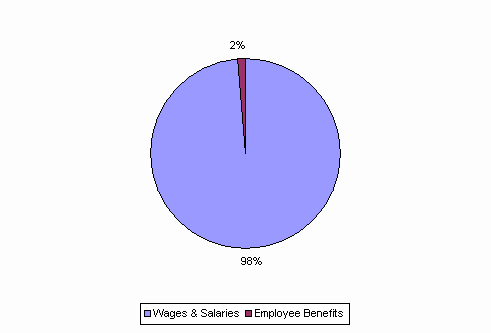
| Wages & Salaries | 25,244 | 25,743 | 25,903 | 21,124 | 23,514 |
| Employee Benefits | 393 | 416 | 357 | 291 | 361 |
| Operating Expenses | 1,268 | 1,287 | 0 | 0 | 0 |
| TOTAL | 26,905 | 27,446 | 26,261 | 21,415 | 23,875 |
FY2011 Spending Category Chart
