|
FY2011 House 2 |
FY2011 House 2 Revised |
FY2011 House Final |
FY2011 Senate Final |
FY2011 GAA |
|
|---|---|---|---|---|---|
| Budget Tracking | 443,217,006 | 443,217,006 | 419,171,908 | 437,515,270 | 424,055,456 |
|
FY2008 GAA |
FY2009 GAA |
FY2010 GAA |
FY2010 Projected |
FY2011 GAA |
|
|---|---|---|---|---|---|
| Historical Budget Levels | 469,012,776 | 492,251,998 | 411,898,263 | 379,900,504 | 424,055,456 |
* GAA is General Appropriation Act.
| SPENDING CATEGORY |
FY2007 Expended |
FY2008 Expended |
FY2009 Expended |
FY2010 Projected |
FY2011 GAA |
|---|---|---|---|---|---|
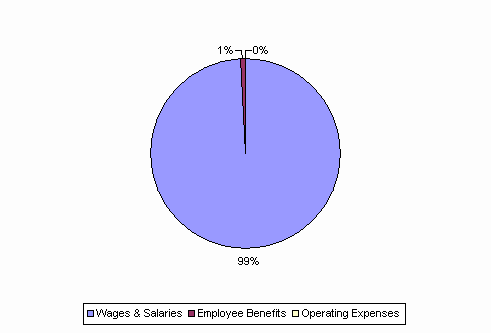
| Wages & Salaries | 465,829 | 478,678 | 462,344 | 377,377 | 420,860 |
| Employee Benefits | 5,171 | 5,147 | 3,088 | 2,520 | 3,191 |
| Operating Expenses | 117 | 134 | 5 | 4 | 5 |
| TOTAL | 471,117 | 483,960 | 465,436 | 379,901 | 424,055 |
FY2011 Spending Category Chart
