|
FY2011 House 2 |
FY2011 House 2 Revised |
FY2011 House Final |
FY2011 Senate Final |
FY2011 GAA |
|
|---|---|---|---|---|---|
| Budget Tracking | 1,890,529 | 1,890,529 | 1,912,958 | 2,090,529 | 1,570,984 |
|
FY2008 GAA |
FY2009 GAA |
FY2010 GAA |
FY2010 Projected |
FY2011 GAA |
|
|---|---|---|---|---|---|
| Historical Budget Levels | 3,475,766 | 6,512,898 | 1,933,249 | 1,890,529 | 1,570,984 |
* GAA is General Appropriation Act.
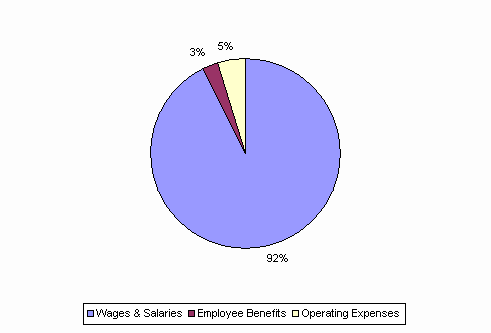
| SPENDING CATEGORY |
FY2007 Expended |
FY2008 Expended |
FY2009 Expended |
FY2010 Projected |
FY2011 GAA |
|---|---|---|---|---|---|
| Wages & Salaries | 1,994 | 1,976 | 1,944 | 1,669 | 1,454 |
| Employee Benefits | 53 | 50 | 51 | 45 | 43 |
| Operating Expenses | 603 | 865 | 1,716 | 176 | 74 |
| Grants & Subsidies | 0 | 533 | 2,395 | 0 | 0 |
| TOTAL | 2,649 | 3,424 | 6,106 | 1,891 | 1,571 |
FY2011 Spending Category Chart