|
FY2011 House 2 |
FY2011 House 2 Revised |
FY2011 House Final |
FY2011 Senate Final |
FY2011 GAA |
|
|---|---|---|---|---|---|
| Budget Tracking | 6,900,841 | 6,900,841 | 6,740,746 | 6,874,476 | 6,740,746 |
|
FY2008 GAA |
FY2009 GAA |
FY2010 GAA |
FY2010 Projected |
FY2011 GAA |
|
|---|---|---|---|---|---|
| Historical Budget Levels | 9,100,434 | 9,175,041 | 6,900,841 | 7,346,431 | 6,740,746 |
* GAA is General Appropriation Act.
| SPENDING CATEGORY |
FY2007 Expended |
FY2008 Expended |
FY2009 Expended |
FY2010 Projected |
FY2011 GAA |
|---|---|---|---|---|---|
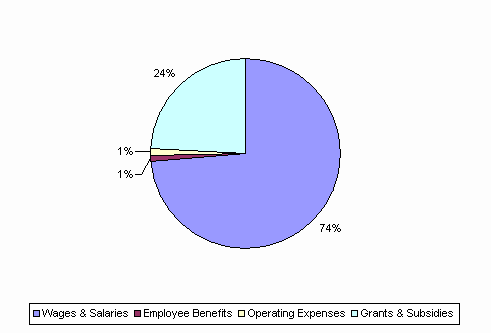
| Wages & Salaries | 3,908 | 6,584 | 4,738 | 4,754 | 4,970 |
| Employee Benefits | 50 | 64 | 58 | 67 | 69 |
| Operating Expenses | 168 | 120 | 59 | 75 | 78 |
| Grants & Subsidies | 687 | 616 | 3,062 | 2,451 | 1,625 |
| TOTAL | 4,814 | 7,384 | 7,917 | 7,346 | 6,741 |
FY2011 Spending Category Chart
