|
FY2011 House 2 |
FY2011 House 2 Revised |
FY2011 House Final |
FY2011 Senate Final |
FY2011 GAA |
|
|---|---|---|---|---|---|
| Budget Tracking | 25,267,854 | 25,267,854 | 25,162,278 | 24,862,278 | 24,362,278 |
|
FY2008 GAA |
FY2009 GAA |
FY2010 GAA |
FY2010 Projected |
FY2011 GAA |
|
|---|---|---|---|---|---|
| Historical Budget Levels | 27,749,039 | 29,310,695 | 25,290,411 | 25,162,278 | 24,362,278 |
* GAA is General Appropriation Act.
| SPENDING CATEGORY |
FY2007 Expended |
FY2008 Expended |
FY2009 Expended |
FY2010 Projected |
FY2011 GAA |
|---|---|---|---|---|---|
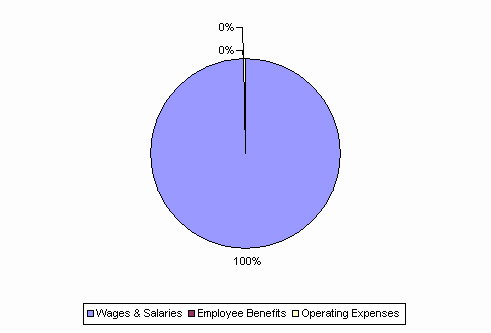
| Wages & Salaries | 27,432 | 27,592 | 27,951 | 25,068 | 24,266 |
| Employee Benefits | 66 | 49 | 51 | 50 | 60 |
| Operating Expenses | 179 | 92 | 82 | 45 | 36 |
| TOTAL | 27,677 | 27,733 | 28,084 | 25,162 | 24,362 |
FY2011 Spending Category Chart
