|
FY2011 House 2 |
FY2011 House 2 Revised |
FY2011 House Final |
FY2011 Senate Final |
FY2011 GAA |
|
|---|---|---|---|---|---|
| Budget Tracking | 4,048,324,258 | 4,048,324,258 | 3,851,193,043 | 3,878,464,421 | 3,851,193,043 |
|
FY2008 GAA |
FY2009 GAA |
FY2010 GAA |
FY2010 Projected |
FY2011 GAA |
|
|---|---|---|---|---|---|
| Historical Budget Levels | 3,725,671,328 | 3,948,824,061 | 3,869,847,585 | 3,869,847,585 | 3,851,193,043 |
* GAA is General Appropriation Act.
| SPENDING CATEGORY |
FY2007 Expended |
FY2008 Expended |
FY2009 Expended |
FY2010 Projected |
FY2011 GAA |
|---|---|---|---|---|---|
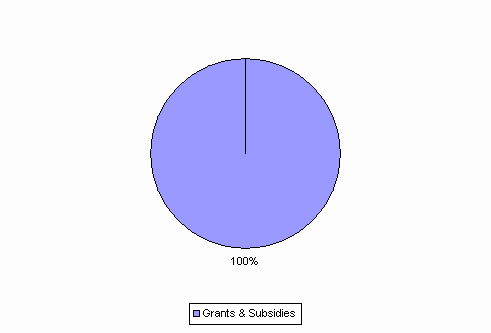
| Grants & Subsidies | 3,505,520 | 3,725,671 | 3,536,824 | 3,869,848 | 3,851,193 |
| TOTAL | 3,505,520 | 3,725,671 | 3,536,824 | 3,869,848 | 3,851,193 |
FY2011 Spending Category Chart
