|
FY2011 House 2 |
FY2011 House 2 Revised |
FY2011 House Final |
FY2011 Senate Final |
FY2011 GAA |
|
|---|---|---|---|---|---|
| Budget Tracking | 8,158,206 | 8,158,206 | 7,475,804 | 7,586,386 | 7,475,804 |
|
FY2008 GAA |
FY2009 GAA |
FY2010 GAA |
FY2010 Projected |
FY2011 GAA |
|
|---|---|---|---|---|---|
| Historical Budget Levels | 7,645,700 | 7,726,719 | 7,685,712 | 7,586,386 | 7,475,804 |
* GAA is General Appropriation Act.
| SPENDING CATEGORY |
FY2007 Expended |
FY2008 Expended |
FY2009 Expended |
FY2010 Projected |
FY2011 GAA |
|---|---|---|---|---|---|
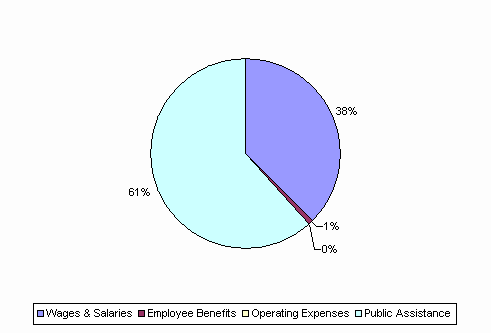
| Wages & Salaries | 2,786 | 2,893 | 2,782 | 2,830 | 2,813 |
| Employee Benefits | 60 | 66 | 64 | 47 | 47 |
| Operating Expenses | 35 | 103 | 49 | 9 | 9 |
| Public Assistance | 4,618 | 4,522 | 4,781 | 4,701 | 4,607 |
| TOTAL | 7,499 | 7,584 | 7,675 | 7,586 | 7,476 |
FY2011 Spending Category Chart
