|
FY2011 House 2 |
FY2011 House 2 Revised |
FY2011 House Final |
FY2011 Senate Final |
FY2011 GAA |
|
|---|---|---|---|---|---|
| Budget Tracking | 13,169,128 | 13,169,128 | 13,131,114 | 13,200,000 | 12,767,009 |
|
FY2008 GAA |
FY2009 GAA |
FY2010 GAA |
FY2010 Projected |
FY2011 GAA |
|
|---|---|---|---|---|---|
| Historical Budget Levels | 13,612,790 | 16,780,047 | 13,750,821 | 13,176,984 | 12,767,009 |
* GAA is General Appropriation Act.
| SPENDING CATEGORY |
FY2007 Expended |
FY2008 Expended |
FY2009 Expended |
FY2010 Projected |
FY2011 GAA |
|---|---|---|---|---|---|
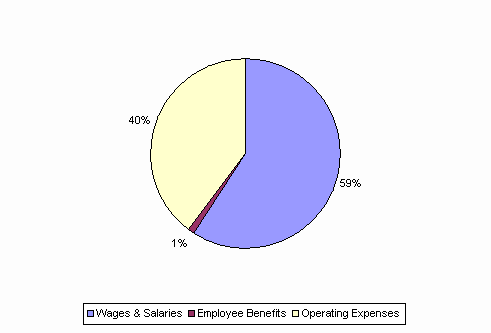
| Wages & Salaries | 7,577 | 10,312 | 9,619 | 8,001 | 7,562 |
| Employee Benefits | 167 | 211 | 212 | 130 | 130 |
| Operating Expenses | 2,768 | 3,365 | 5,619 | 5,045 | 5,075 |
| Public Assistance | 0 | 0 | 92 | 0 | 0 |
| Grants & Subsidies | 500 | 45 | 147 | 0 | 0 |
| TOTAL | 11,012 | 13,934 | 15,690 | 13,177 | 12,767 |
FY2011 Spending Category Chart
