|
FY2011 House 2 |
FY2011 House 2 Revised |
FY2011 House Final |
FY2011 Senate Final |
FY2011 GAA |
|
|---|---|---|---|---|---|
| Budget Tracking | 1,834,484 | 1,834,484 | 1,834,484 | 0 | 1,834,484 |
|
FY2008 GAA |
FY2009 GAA |
FY2010 GAA |
FY2010 Projected |
FY2011 GAA |
|
|---|---|---|---|---|---|
| Historical Budget Levels | 28,231,965 | 37,087,309 | 7,483,636 | 5,500,540 | 1,834,484 |
* GAA is General Appropriation Act.
| SPENDING CATEGORY |
FY2007 Expended |
FY2008 Expended |
FY2009 Expended |
FY2010 Projected |
FY2011 GAA |
|---|---|---|---|---|---|
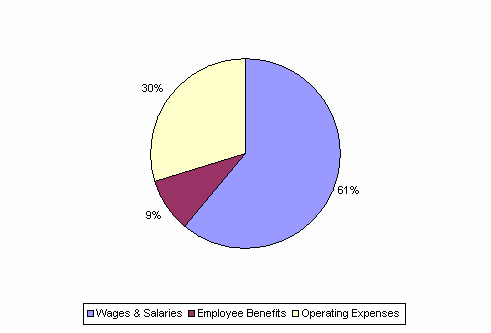
| Wages & Salaries | 6,934 | 9,442 | 7,998 | 4,421 | 1,120 |
| Employee Benefits | 45 | 90 | 73 | 106 | 171 |
| Operating Expenses | 1,431 | 1,211 | 987 | 724 | 544 |
| Public Assistance | 0 | 0 | 25 | 0 | 0 |
| Grants & Subsidies | 25,482 | 17,059 | 8,639 | 250 | 0 |
| TOTAL | 33,892 | 27,802 | 17,722 | 5,501 | 1,834 |
FY2011 Spending Category Chart
