|
FY2011 House 2 |
FY2011 House 2 Revised |
FY2011 House Final |
FY2011 Senate Final |
FY2011 GAA |
|
|---|---|---|---|---|---|
| Budget Tracking | 632,142 | 632,142 | 440,863 | 434,216 | 434,216 |
|
FY2008 GAA |
FY2009 GAA |
FY2010 GAA |
FY2010 Projected |
FY2011 GAA |
|
|---|---|---|---|---|---|
| Historical Budget Levels | 390,592 | 585,914 | 506,531 | 465,011 | 434,216 |
* GAA is General Appropriation Act.
| SPENDING CATEGORY |
FY2007 Expended |
FY2008 Expended |
FY2009 Expended |
FY2010 Projected |
FY2011 GAA |
|---|---|---|---|---|---|
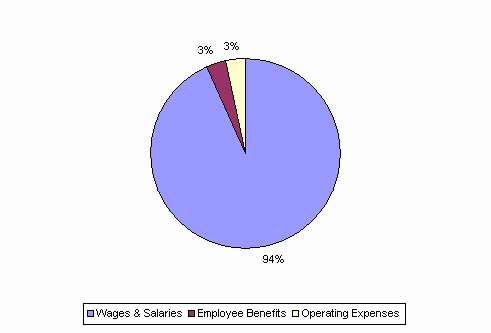
| Wages & Salaries | 370 | 360 | 432 | 431 | 406 |
| Employee Benefits | 10 | 9 | 11 | 16 | 14 |
| Operating Expenses | 8 | 8 | 33 | 18 | 15 |
| TOTAL | 387 | 377 | 476 | 465 | 434 |
FY2011 Spending Category Chart
