|
FY2011 House 2 |
FY2011 House 2 Revised |
FY2011 House Final |
FY2011 Senate Final |
FY2011 GAA |
|
|---|---|---|---|---|---|
| Budget Tracking | 8,081,928 | 8,081,928 | 8,081,928 | 8,081,928 | 8,081,928 |
|
FY2008 GAA |
FY2009 GAA |
FY2010 GAA |
FY2010 Projected |
FY2011 GAA |
|
|---|---|---|---|---|---|
| Historical Budget Levels | 8,018,911 | 8,105,485 | 8,148,410 | 8,146,363 | 8,081,928 |
* GAA is General Appropriation Act.
| SPENDING CATEGORY |
FY2007 Expended |
FY2008 Expended |
FY2009 Expended |
FY2010 Projected |
FY2011 GAA |
|---|---|---|---|---|---|
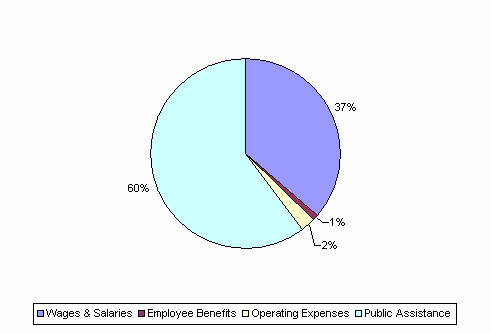
| Wages & Salaries | 2,961 | 3,111 | 3,034 | 2,980 | 2,951 |
| Employee Benefits | 24 | 22 | 62 | 69 | 69 |
| Operating Expenses | 197 | 198 | 193 | 193 | 193 |
| Public Assistance | 3,487 | 4,732 | 4,691 | 4,904 | 4,869 |
| TOTAL | 6,669 | 8,063 | 7,980 | 8,146 | 8,082 |
FY2011 Spending Category Chart
