|
FY2011 House 2 |
FY2011 House 2 Revised |
FY2011 House Final |
FY2011 Senate Final |
FY2011 GAA |
|
|---|---|---|---|---|---|
| Budget Tracking | 27,375,404 | 27,375,404 | 27,180,686 | 27,441,982 | 26,401,636 |
|
FY2008 GAA |
FY2009 GAA |
FY2010 GAA |
FY2010 Projected |
FY2011 GAA |
|
|---|---|---|---|---|---|
| Historical Budget Levels | 40,141,898 | 38,359,864 | 29,648,399 | 28,672,820 | 26,401,636 |
* GAA is General Appropriation Act.
| SPENDING CATEGORY |
FY2007 Expended |
FY2008 Expended |
FY2009 Expended |
FY2010 Projected |
FY2011 GAA |
|---|---|---|---|---|---|
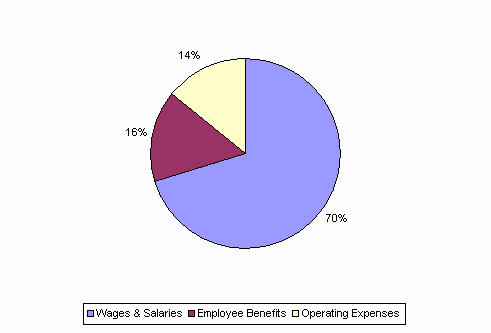
| Wages & Salaries | 25,335 | 25,643 | 25,718 | 19,986 | 18,519 |
| Employee Benefits | 7,494 | 7,519 | 3,973 | 4,753 | 4,120 |
| Operating Expenses | 6,417 | 6,991 | 6,790 | 3,934 | 3,763 |
| Public Assistance | 101 | 101 | 100 | 0 | 0 |
| TOTAL | 39,347 | 40,253 | 36,582 | 28,673 | 26,402 |
FY2011 Spending Category Chart
