|
FY2011 House 2 |
FY2011 House 2 Revised |
FY2011 House Final |
FY2011 Senate Final |
FY2011 GAA |
|
|---|---|---|---|---|---|
| Budget Tracking | 0 | 0 | 155,132,355 | 155,572,202 | 155,132,354 |
|
FY2008 GAA |
FY2009 GAA |
FY2010 GAA |
FY2010 Projected |
FY2011 GAA |
|
|---|---|---|---|---|---|
| Historical Budget Levels | 147,289,334 | 157,262,697 | 155,319,220 | 154,787,080 | 155,132,354 |
* GAA is General Appropriation Act.
| SPENDING CATEGORY |
FY2007 Expended |
FY2008 Expended |
FY2009 Expended |
FY2010 Projected |
FY2011 GAA |
|---|---|---|---|---|---|
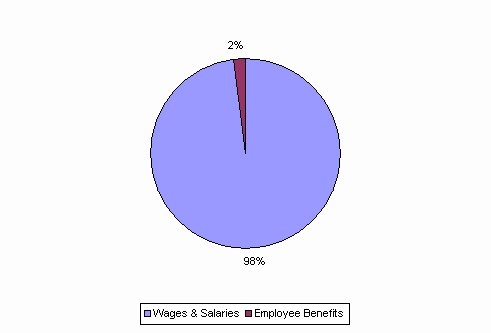
| Wages & Salaries | 143,429 | 155,531 | 154,039 | 152,680 | 152,177 |
| Employee Benefits | 0 | 0 | 2,018 | 2,107 | 2,955 |
| Operating Expenses | 41 | 0 | 5 | 0 | 0 |
| TOTAL | 143,470 | 155,531 | 156,062 | 154,787 | 155,132 |
FY2011 Spending Category Chart
