|
FY2011 House 2 |
FY2011 House 2 Revised |
FY2011 House Final |
FY2011 Senate Final |
FY2011 GAA |
|
|---|---|---|---|---|---|
| Budget Tracking | 0 | 0 | 202,586,479 | 205,419,166 | 201,586,480 |
|
FY2008 GAA |
FY2009 GAA |
FY2010 GAA |
FY2010 Projected |
FY2011 GAA |
|
|---|---|---|---|---|---|
| Historical Budget Levels | 228,236,983 | 229,554,705 | 223,569,417 | 217,669,056 | 201,586,480 |
* GAA is General Appropriation Act.
| SPENDING CATEGORY |
FY2007 Expended |
FY2008 Expended |
FY2009 Expended |
FY2010 Projected |
FY2011 GAA |
|---|---|---|---|---|---|
| Wages & Salaries | 157 | 119 | 37 | 0 | 0 |
| Employee Benefits | 0 | 1 | 0 | 0 | 0 |
| Operating Expenses | 480 | 110 | 142 | 0 | 0 |
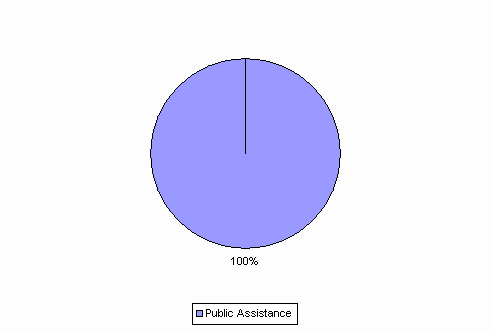
| Public Assistance | 244,698 | 230,244 | 222,587 | 217,669 | 201,586 |
| TOTAL | 245,335 | 230,473 | 222,766 | 217,669 | 201,586 |
FY2011 Spending Category Chart
