|
FY2011 House 2 |
FY2011 House 2 Revised |
FY2011 House Final |
FY2011 Senate Final |
FY2011 GAA |
|
|---|---|---|---|---|---|
| Budget Tracking | 497,219,634 | 497,219,634 | 248,981,594 | 295,282,464 | 247,433,594 |
|
FY2008 GAA |
FY2009 GAA |
FY2010 GAA |
FY2010 Projected |
FY2011 GAA |
|
|---|---|---|---|---|---|
| Historical Budget Levels | 293,662,736 | 313,792,694 | 299,234,364 | 291,876,074 | 247,433,594 |
* GAA is General Appropriation Act.
| SPENDING CATEGORY |
FY2007 Expended |
FY2008 Expended |
FY2009 Expended |
FY2010 Projected |
FY2011 GAA |
|---|---|---|---|---|---|
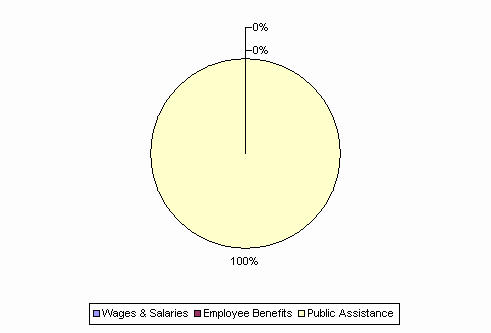
| Wages & Salaries | 540 | 574 | 435 | 327 | 300 |
| Employee Benefits | 0 | 5 | 5 | 5 | 7 |
| Operating Expenses | 624 | 0 | 619 | 110 | 0 |
| Public Assistance | 286,789 | 296,748 | 298,732 | 291,435 | 247,127 |
| TOTAL | 287,952 | 297,327 | 299,791 | 291,876 | 247,434 |
FY2011 Spending Category Chart