|
FY2011 House 2 |
FY2011 House 2 Revised |
FY2011 House Final |
FY2011 Senate Final |
FY2011 GAA |
|
|---|---|---|---|---|---|
| Budget Tracking | 0 | 0 | 700,989 | 697,508 | 697,508 |
|
FY2008 GAA |
FY2009 GAA |
FY2010 GAA |
FY2010 Projected |
FY2011 GAA |
|
|---|---|---|---|---|---|
| Historical Budget Levels | 739,182 | 740,076 | 697,508 | 697,508 | 697,508 |
* GAA is General Appropriation Act.
| SPENDING CATEGORY |
FY2007 Expended |
FY2008 Expended |
FY2009 Expended |
FY2010 Projected |
FY2011 GAA |
|---|---|---|---|---|---|
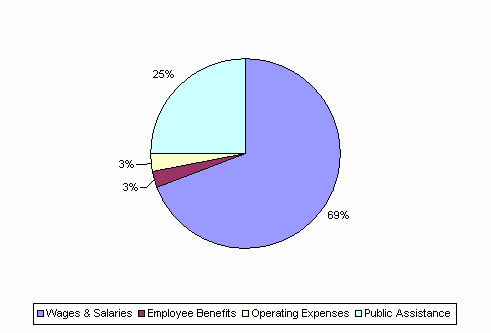
| Wages & Salaries | 480 | 484 | 503 | 487 | 482 |
| Employee Benefits | 16 | 16 | 12 | 13 | 19 |
| Operating Expenses | 53 | 48 | 24 | 24 | 22 |
| Public Assistance | 173 | 175 | 171 | 174 | 174 |
| TOTAL | 723 | 723 | 709 | 698 | 698 |
FY2011 Spending Category Chart
