|
FY2011 House 2 |
FY2011 House 2 Revised |
FY2011 House Final |
FY2011 Senate Final |
FY2011 GAA |
|
|---|---|---|---|---|---|
| Budget Tracking | 0 | 0 | 133,665,758 | 139,429,106 | 139,429,106 |
|
FY2008 GAA |
FY2009 GAA |
FY2010 GAA |
FY2010 Projected |
FY2011 GAA |
|
|---|---|---|---|---|---|
| Historical Budget Levels | 135,205,883 | 144,881,131 | 137,664,607 | 135,616,148 | 139,429,106 |
* GAA is General Appropriation Act.
| SPENDING CATEGORY |
FY2007 Expended |
FY2008 Expended |
FY2009 Expended |
FY2010 Projected |
FY2011 GAA |
|---|---|---|---|---|---|
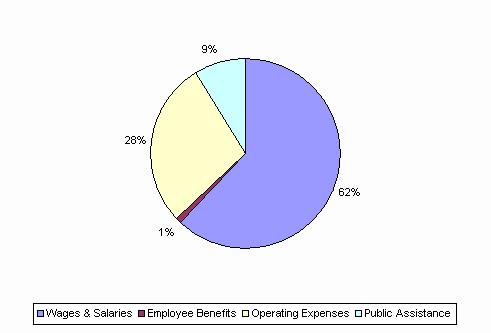
| Wages & Salaries | 86,106 | 88,048 | 87,700 | 84,376 | 86,280 |
| Employee Benefits | 46 | 53 | 1,211 | 1,240 | 1,705 |
| Operating Expenses | 37,248 | 37,648 | 38,737 | 37,250 | 39,089 |
| Public Assistance | 11,713 | 12,079 | 12,539 | 12,751 | 12,355 |
| TOTAL | 135,114 | 137,828 | 140,187 | 135,616 | 139,429 |
FY2011 Spending Category Chart
