|
FY2011 House 2 |
FY2011 House 2 Revised |
FY2011 House Final |
FY2011 Senate Final |
FY2011 GAA |
|
|---|---|---|---|---|---|
| Budget Tracking | 0 | 0 | 15,650,079 | 16,400,049 | 16,400,049 |
|
FY2008 GAA |
FY2009 GAA |
FY2010 GAA |
FY2010 Projected |
FY2011 GAA |
|
|---|---|---|---|---|---|
| Historical Budget Levels | 16,007,368 | 16,542,017 | 16,554,915 | 16,305,881 | 16,400,049 |
* GAA is General Appropriation Act.
| SPENDING CATEGORY |
FY2007 Expended |
FY2008 Expended |
FY2009 Expended |
FY2010 Projected |
FY2011 GAA |
|---|---|---|---|---|---|
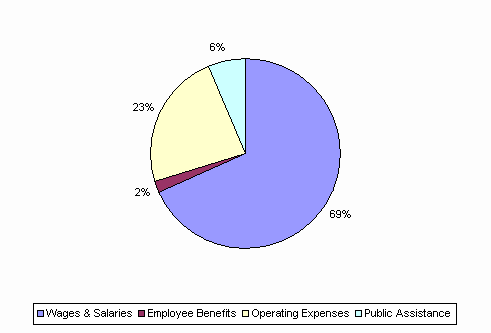
| Wages & Salaries | 11,080 | 11,179 | 11,497 | 11,191 | 11,202 |
| Employee Benefits | 336 | 326 | 321 | 324 | 325 |
| Operating Expenses | 2,793 | 3,154 | 3,366 | 3,763 | 3,817 |
| Public Assistance | 1,420 | 1,105 | 986 | 1,027 | 1,057 |
| TOTAL | 15,629 | 15,763 | 16,170 | 16,306 | 16,400 |
FY2011 Spending Category Chart
