|
FY2011 House 2 |
FY2011 House 2 Revised |
FY2011 House Final |
FY2011 Senate Final |
FY2011 GAA |
|
|---|---|---|---|---|---|
| Budget Tracking | 0 | 0 | 11,697,967 | 11,724,925 | 11,597,967 |
|
FY2008 GAA |
FY2009 GAA |
FY2010 GAA |
FY2010 Projected |
FY2011 GAA |
|
|---|---|---|---|---|---|
| Historical Budget Levels | 16,748,474 | 17,457,134 | 13,422,121 | 11,719,537 | 11,597,967 |
* GAA is General Appropriation Act.
| SPENDING CATEGORY |
FY2007 Expended |
FY2008 Expended |
FY2009 Expended |
FY2010 Projected |
FY2011 GAA |
|---|---|---|---|---|---|
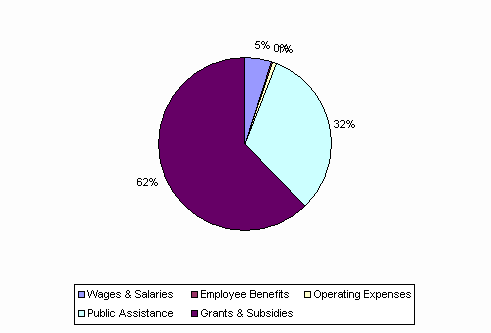
| Wages & Salaries | 820 | 818 | 701 | 431 | 589 |
| Employee Benefits | 2 | 5 | 17 | 49 | 13 |
| Operating Expenses | 339 | 221 | 296 | 148 | 117 |
| Public Assistance | 5,129 | 5,160 | 5,180 | 3,701 | 3,677 |
| Grants & Subsidies | 10,313 | 10,319 | 10,230 | 7,391 | 7,203 |
| TOTAL | 16,603 | 16,523 | 16,424 | 11,720 | 11,598 |
FY2011 Spending Category Chart
