|
FY2011 House 2 |
FY2011 House 2 Revised |
FY2011 House Final |
FY2011 Senate Final |
FY2011 GAA |
|
|---|---|---|---|---|---|
| Budget Tracking | 0 | 0 | 13,329,260 | 13,293,542 | 13,293,542 |
|
FY2008 GAA |
FY2009 GAA |
FY2010 GAA |
FY2010 Projected |
FY2011 GAA |
|
|---|---|---|---|---|---|
| Historical Budget Levels | 15,050,499 | 15,653,231 | 13,676,268 | 13,416,459 | 13,293,542 |
* GAA is General Appropriation Act.
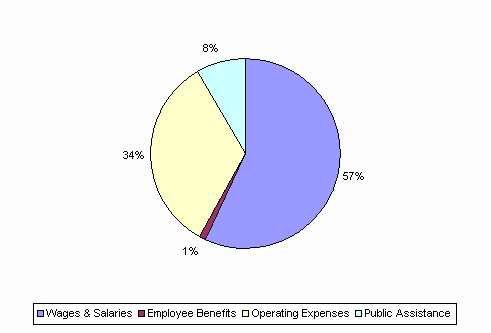
| SPENDING CATEGORY |
FY2007 Expended |
FY2008 Expended |
FY2009 Expended |
FY2010 Projected |
FY2011 GAA |
|---|---|---|---|---|---|
| Wages & Salaries | 7,759 | 8,766 | 8,835 | 7,733 | 7,575 |
| Employee Benefits | 34 | 32 | 128 | 125 | 157 |
| Operating Expenses | 4,805 | 4,564 | 4,869 | 4,458 | 4,458 |
| Public Assistance | 1,753 | 1,669 | 1,219 | 1,101 | 1,104 |
| TOTAL | 14,350 | 15,031 | 15,050 | 13,416 | 13,294 |
FY2011 Spending Category Chart