|
FY2011 House 2 |
FY2011 House 2 Revised |
FY2011 House Final |
FY2011 Senate Final |
FY2011 GAA |
|
|---|---|---|---|---|---|
| Budget Tracking | 0 | 0 | 6,224,484 | 6,300,000 | 5,949,484 |
|
FY2008 GAA |
FY2009 GAA |
FY2010 GAA |
FY2010 Projected |
FY2011 GAA |
|
|---|---|---|---|---|---|
| Historical Budget Levels | 14,169,012 | 14,709,996 | 7,295,685 | 6,286,478 | 5,949,484 |
* GAA is General Appropriation Act.
| SPENDING CATEGORY |
FY2007 Expended |
FY2008 Expended |
FY2009 Expended |
FY2010 Projected |
FY2011 GAA |
|---|---|---|---|---|---|
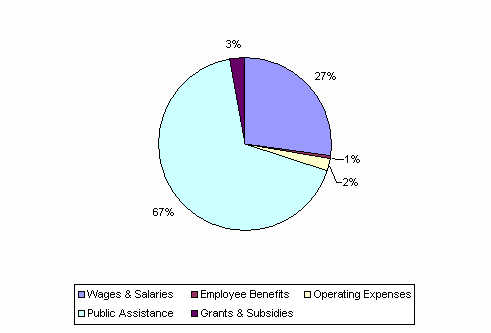
| Wages & Salaries | 45 | 4,094 | 3,540 | 1,605 | 1,618 |
| Employee Benefits | 0 | 34 | 39 | 36 | 31 |
| Operating Expenses | 0 | 793 | 622 | 212 | 137 |
| Public Assistance | 50 | 7,738 | 7,525 | 4,289 | 4,006 |
| Grants & Subsidies | 0 | 248 | 239 | 145 | 158 |
| TOTAL | 94 | 12,907 | 11,965 | 6,286 | 5,949 |
FY2011 Spending Category Chart
