|
FY2011 House 2 |
FY2011 House 2 Revised |
FY2011 House Final |
FY2011 Senate Final |
FY2011 GAA |
|
|---|---|---|---|---|---|
| Budget Tracking | 0 | 0 | 25,449,383 | 26,997,264 | 24,949,384 |
|
FY2008 GAA |
FY2009 GAA |
FY2010 GAA |
FY2010 Projected |
FY2011 GAA |
|
|---|---|---|---|---|---|
| Historical Budget Levels | 38,237,286 | 42,936,049 | 25,554,904 | 27,554,904 | 24,949,384 |
* GAA is General Appropriation Act.
| SPENDING CATEGORY |
FY2007 Expended |
FY2008 Expended |
FY2009 Expended |
FY2010 Projected |
FY2011 GAA |
|---|---|---|---|---|---|
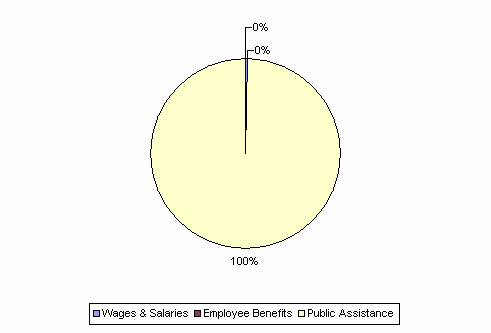
| Wages & Salaries | 10 | 10 | 54 | 76 | 76 |
| Employee Benefits | 0 | 0 | 2 | 8 | 2 |
| Operating Expenses | 0 | 0 | 0 | 0 | 0 |
| Public Assistance | 32,939 | 40,211 | 41,525 | 27,471 | 24,871 |
| TOTAL | 32,949 | 40,221 | 41,581 | 27,555 | 24,949 |
FY2011 Spending Category Chart
