|
FY2011 House 2 |
FY2011 House 2 Revised |
FY2011 House Final |
FY2011 Senate Final |
FY2011 GAA |
|
|---|---|---|---|---|---|
| Budget Tracking | 0 | 0 | 3,160,740 | 3,460,740 | 3,160,740 |
|
FY2008 GAA |
FY2009 GAA |
FY2010 GAA |
FY2010 Projected |
FY2011 GAA |
|
|---|---|---|---|---|---|
| Historical Budget Levels | 3,610,111 | 3,623,068 | 3,003,336 | 3,153,336 | 3,160,740 |
* GAA is General Appropriation Act.
| SPENDING CATEGORY |
FY2007 Expended |
FY2008 Expended |
FY2009 Expended |
FY2010 Projected |
FY2011 GAA |
|---|---|---|---|---|---|
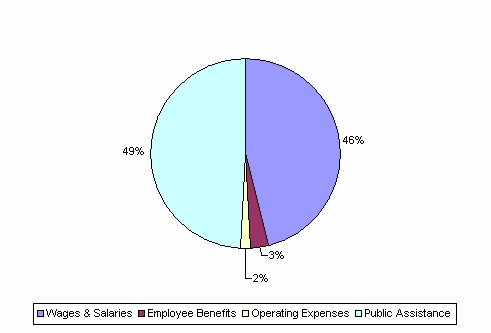
| Wages & Salaries | 1,144 | 1,259 | 1,463 | 1,449 | 1,459 |
| Employee Benefits | 62 | 73 | 83 | 84 | 91 |
| Operating Expenses | 114 | 181 | 89 | 41 | 61 |
| Public Assistance | 2,195 | 2,276 | 1,953 | 1,580 | 1,550 |
| TOTAL | 3,515 | 3,789 | 3,588 | 3,153 | 3,161 |
FY2011 Spending Category Chart
