|
FY2011 House 2 |
FY2011 House 2 Revised |
FY2011 House Final |
FY2011 Senate Final |
FY2011 GAA |
|
|---|---|---|---|---|---|
| Budget Tracking | 0 | 0 | 1,335,072 | 1,338,646 | 1,335,072 |
|
FY2008 GAA |
FY2009 GAA |
FY2010 GAA |
FY2010 Projected |
FY2011 GAA |
|
|---|---|---|---|---|---|
| Historical Budget Levels | 1,304,922 | 1,330,387 | 1,342,269 | 1,338,646 | 1,335,072 |
* GAA is General Appropriation Act.
| SPENDING CATEGORY |
FY2007 Expended |
FY2008 Expended |
FY2009 Expended |
FY2010 Projected |
FY2011 GAA |
|---|---|---|---|---|---|
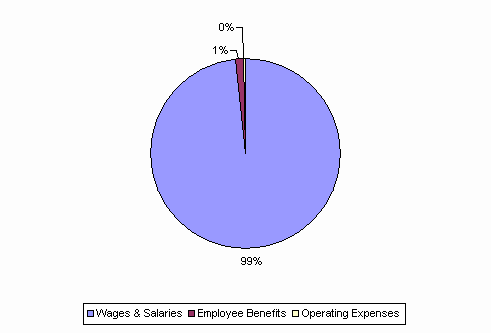
| Wages & Salaries | 979 | 1,042 | 1,176 | 1,302 | 1,313 |
| Employee Benefits | 35 | 32 | 31 | 18 | 18 |
| Operating Expenses | 202 | 146 | 30 | 19 | 4 |
| Grants & Subsidies | 8 | 0 | 92 | 0 | 0 |
| TOTAL | 1,223 | 1,220 | 1,328 | 1,339 | 1,335 |
FY2011 Spending Category Chart
