|
FY2011 House 2 |
FY2011 House 2 Revised |
FY2011 House Final |
FY2011 Senate Final |
FY2011 GAA |
|
|---|---|---|---|---|---|
| Budget Tracking | 0 | 0 | 2,880,694 | 3,381,632 | 2,880,694 |
|
FY2008 GAA |
FY2009 GAA |
FY2010 GAA |
FY2010 Projected |
FY2011 GAA |
|
|---|---|---|---|---|---|
| Historical Budget Levels | 2,631,112 | 2,932,760 | 2,355,724 | 1,931,273 | 2,880,694 |
* GAA is General Appropriation Act.
| SPENDING CATEGORY |
FY2007 Expended |
FY2008 Expended |
FY2009 Expended |
FY2010 Projected |
FY2011 GAA |
|---|---|---|---|---|---|
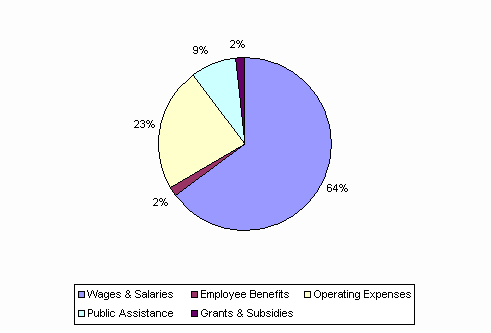
| Wages & Salaries | 432 | 553 | 577 | 1,057 | 1,866 |
| Employee Benefits | 7 | 11 | 18 | 27 | 45 |
| Operating Expenses | 147 | 954 | 494 | 547 | 669 |
| Public Assistance | 236 | 250 | 250 | 250 | 250 |
| Grants & Subsidies | 1,500 | 1,500 | 1,500 | 50 | 50 |
| TOTAL | 2,322 | 3,268 | 2,840 | 1,931 | 2,881 |
FY2011 Spending Category Chart
