|
FY2011 House 2 |
FY2011 House 2 Revised |
FY2011 House Final |
FY2011 Senate Final |
FY2011 GAA |
|
|---|---|---|---|---|---|
| Budget Tracking | 112,549,581 | 112,549,581 | 52,747,472 | 53,100,830 | 51,584,416 |
|
FY2008 GAA |
FY2009 GAA |
FY2010 GAA |
FY2010 Projected |
FY2011 GAA |
|
|---|---|---|---|---|---|
| Historical Budget Levels | 68,057,840 | 68,136,719 | 52,727,596 | 51,826,674 | 51,584,416 |
* GAA is General Appropriation Act.
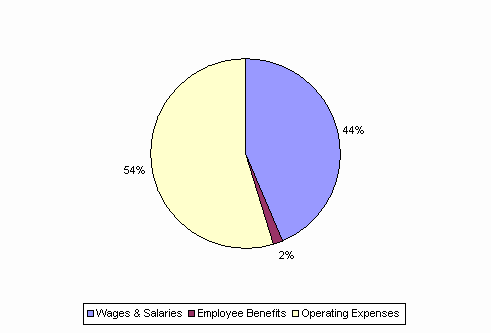
| SPENDING CATEGORY |
FY2007 Expended |
FY2008 Expended |
FY2009 Expended |
FY2010 Projected |
FY2011 GAA |
|---|---|---|---|---|---|
| Wages & Salaries | 30,432 | 31,550 | 31,179 | 23,694 | 22,527 |
| Employee Benefits | 928 | 1,121 | 1,081 | 1,046 | 838 |
| Operating Expenses | 33,413 | 34,694 | 32,368 | 27,087 | 28,220 |
| Public Assistance | 125 | 0 | 0 | 0 | 0 |
| TOTAL | 64,898 | 67,365 | 64,628 | 51,827 | 51,584 |
FY2011 Spending Category Chart