|
FY2011 House 2 |
FY2011 House 2 Revised |
FY2011 House Final |
FY2011 Senate Final |
FY2011 GAA |
|
|---|---|---|---|---|---|
| Budget Tracking | 0 | 0 | 11,856,433 | 11,897,969 | 11,851,933 |
|
FY2008 GAA |
FY2009 GAA |
FY2010 GAA |
FY2010 Projected |
FY2011 GAA |
|
|---|---|---|---|---|---|
| Historical Budget Levels | 11,401,483 | 12,449,034 | 11,946,137 | 11,942,751 | 11,851,933 |
* GAA is General Appropriation Act.
| SPENDING CATEGORY |
FY2007 Expended |
FY2008 Expended |
FY2009 Expended |
FY2010 Projected |
FY2011 GAA |
|---|---|---|---|---|---|
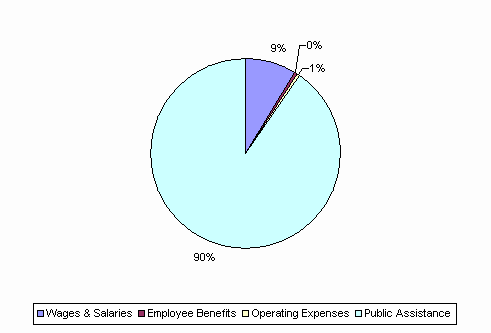
| Wages & Salaries | 898 | 1,129 | 1,179 | 1,025 | 1,031 |
| Employee Benefits | 45 | 44 | 44 | 46 | 46 |
| Operating Expenses | 57 | 80 | 84 | 73 | 69 |
| Public Assistance | 9,108 | 9,888 | 9,808 | 10,798 | 10,706 |
| TOTAL | 10,108 | 11,141 | 11,115 | 11,943 | 11,852 |
FY2011 Spending Category Chart
