|
FY2011 House 2 |
FY2011 House 2 Revised |
FY2011 House Final |
FY2011 Senate Final |
FY2011 GAA |
|
|---|---|---|---|---|---|
| Budget Tracking | 21,207,713 | 21,207,713 | 457,893 | 457,893 | 457,893 |
|
FY2008 GAA |
FY2009 GAA |
FY2010 GAA |
FY2010 Projected |
FY2011 GAA |
|
|---|---|---|---|---|---|
| Historical Budget Levels | 586,400 | 647,128 | 472,928 | 466,970 | 457,893 |
* GAA is General Appropriation Act.
| SPENDING CATEGORY |
FY2007 Expended |
FY2008 Expended |
FY2009 Expended |
FY2010 Projected |
FY2011 GAA |
|---|---|---|---|---|---|
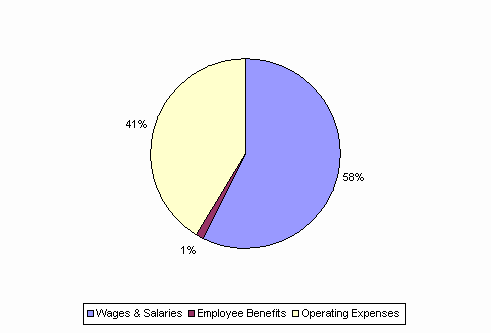
| Wages & Salaries | 288 | 412 | 324 | 271 | 262 |
| Employee Benefits | 46 | 15 | 5 | 6 | 6 |
| Operating Expenses | 219 | 188 | 266 | 190 | 190 |
| TOTAL | 553 | 615 | 596 | 467 | 458 |
FY2011 Spending Category Chart
