|
FY2011 House 2 |
FY2011 House 2 Revised |
FY2011 House Final |
FY2011 Senate Final |
FY2011 GAA |
|
|---|---|---|---|---|---|
| Budget Tracking | 1,721,468,034 | 1,721,468,036 | 1,722,325,021 | 1,711,468,034 | 1,667,529,464 |
|
FY2008 GAA |
FY2009 GAA |
FY2010 GAA |
FY2010 Projected |
FY2011 GAA |
|
|---|---|---|---|---|---|
| Historical Budget Levels | 1,683,746,704 | 1,535,816,000 | 1,607,619,796 | 1,719,349,286 | 1,667,529,464 |
* GAA is General Appropriation Act.
| SPENDING CATEGORY |
FY2007 Expended |
FY2008 Expended |
FY2009 Expended |
FY2010 Projected |
FY2011 GAA |
|---|---|---|---|---|---|
| Wages & Salaries | 7,825 | 9,146 | 7,872 | 9,711 | 0 |
| Employee Benefits | 0 | 0 | 3 | 9 | 0 |
| Operating Expenses | 8,757 | 9,382 | 9,682 | 4,217 | 0 |
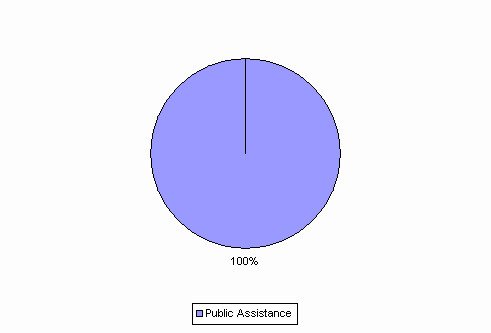
| Public Assistance | 1,457,095 | 1,604,696 | 1,531,272 | 1,705,412 | 1,667,529 |
| TOTAL | 1,473,677 | 1,623,224 | 1,548,829 | 1,719,349 | 1,667,529 |
FY2011 Spending Category Chart
