|
FY2011 House 2 |
FY2011 House 2 Revised |
FY2011 House Final |
FY2011 Senate Final |
FY2011 GAA |
|
|---|---|---|---|---|---|
| Budget Tracking | 11,889,917 | 11,889,917 | 11,785,583 | 11,622,212 | 11,305,673 |
|
FY2008 GAA |
FY2009 GAA |
FY2010 GAA |
FY2010 Projected |
FY2011 GAA |
|
|---|---|---|---|---|---|
| Historical Budget Levels | 13,496,287 | 13,867,894 | 11,944,704 | 11,650,187 | 11,305,673 |
* GAA is General Appropriation Act.
| SPENDING CATEGORY |
FY2007 Expended |
FY2008 Expended |
FY2009 Expended |
FY2010 Projected |
FY2011 GAA |
|---|---|---|---|---|---|
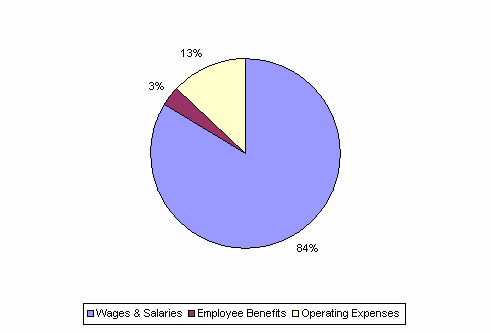
| Wages & Salaries | 9,130 | 10,658 | 10,562 | 9,804 | 9,450 |
| Employee Benefits | 258 | 336 | 369 | 397 | 387 |
| Operating Expenses | 1,848 | 2,989 | 2,286 | 1,449 | 1,468 |
| TOTAL | 11,237 | 13,984 | 13,218 | 11,650 | 11,306 |
FY2011 Spending Category Chart
